Using the most suitable instruments and tools for data collection is essential to ensure the accuracy and reliability of your research findings. High-quality tools enable precise measurement and comprehensive data gathering, providing a solid foundation for analysis and interpretation.
Before you get started, watch this short video on data collection:
Slides are available here: Data Collection Slides
Knowing your goal is essential, of course. What is the purpose of your intervention?
When defining a goal for data collection in an action research project, consider what specific insights or outcomes you want to achieve from the data. For example:
Goal: Determine if project-based learning (PBL) improves seconday school students’ understanding and application of algorithms.
By clearly defining what you want to learn from the data, you can design a focused and effective data collection plan that provides meaningful insights to inform your teaching practice and research objectives.
Activity:
Download the Teacher Research Projects 2024 Booklet and examine the sections on “Motivation and research question” for a couple of projects. Which goals did the teachers pursue with their research?
The main difference between quantitative and qualitative research is the type of data they collect and analyse.
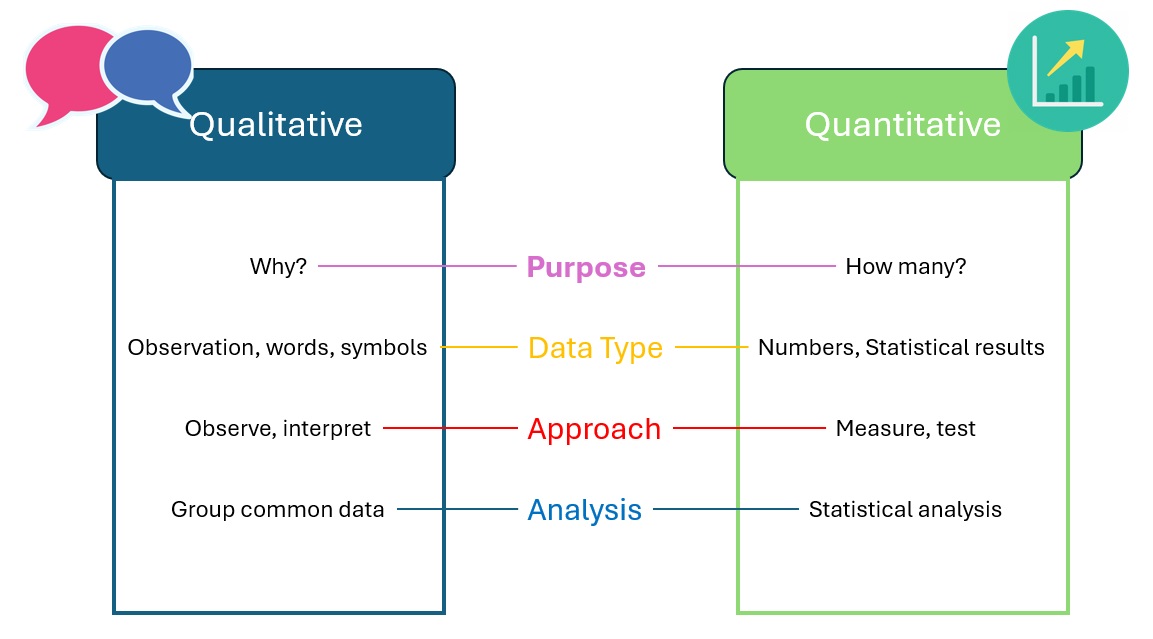
Quantitative research collects numerical data and analyses it using statistical methods. The aim is to produce objective, empirical data that can be measured and expressed in numerical terms. Quantitative research is often used to test hypotheses, identify patterns, and make predictions. Typically, quantitative research will use surveys with closed questions, test scores, measurements and numerical observations etc..
Quantitative research allows you to confirm or test a hypothesis or theory or quantify a specific problem or quality.
Qualitative research, on the other hand, is descriptive and deals with qualities or characteristics that cannot be measured numerically. The focus is on exploring subjective experiences, opinions, and attitudes, often through observation and interviews or surveys with open-ended responses.
Qualitative research allows you to understand concepts or experiences.
Some questions lend themselves to a mixture of the two, known as Mixed Method Research.
There are a number of instruments and tools you can use to gather your qualitative data, e.g.
Interviews/Focus Groups
Interviews are better with adults or post-16 students, while focus groups work better with younger age-groups. It might sound obvious but plan the questions beforehand checking that each will be contributing to your research question. With some groups asking them to complete a short activity as part of the interview/focus group can work well.
If you wish to record the session, then ensure that you seek permission beforehand (including parents as appropriate).
It can be easy to fall into the trap of “research bias” and ask leading questions that are designed to support your hypothesis. All questions should be unbiased prompts designed to collect data and must not be skewed in such a way that leads the participant(s) to answer in a particular way.
By way of example, given the research question: How do computing teachers use LLMs?
Section 1: Teachers’ experience with LLMs (approx. 7 minutes)
Section 2: Perceived benefits and challenges (approx. 10 minutes)
Section 3: etc..
Artefacts
Artefacts such as homework, programs, projects, and screenshots can be valuable data in an action research project. These artefacts provide concrete evidence of student work and progress. However, it is crucial to anonymise student projects before sharing them outside your school to protect student privacy. Additionally, you should check your school policy regarding the use of anonymised projects to ensure compliance with consent requirements, as policies may vary on whether you need explicit consent to use such data.
School documentation
School documentation, including schemes of work, lesson plans, policies, and learning materials, are all useful data sources. These documents can provide insights into the planning and delivery of the curriculum and how it aligns with educational goals. As long as they are anonymised (school name removed), consent is not normally needed to use these materials. This allows for the sharing and analysis of instructional strategies without compromising the privacy of the school or its staff.
Journals and unstructured observations
Journals and unstructured observations can provide rich qualitative data for an action research project. These might include writing (or audio recording) your own reflections after a particular lesson or event, observing a colleague’s lesson and making notes (or vice versa), or writing a journal entry regularly for a period of time. These methods allow for a deep exploration of teaching practices, student interactions, and classroom dynamics from a reflective and subjective perspective.
Structured observations
Structured observations, sometimes called systematic observations, involve completing a form during the lesson to record specific events at certain times. This method can generate quantitative data, providing a more objective and consistent way to measure and compare different aspects of classroom activity. Structured observations can help identify patterns and trends in teaching and learning, offering valuable insights for data-driven decision-making in educational practice.
Questionnaires (also called surveys)
Questionnaires are versatile tools that can be used to collect both quantitative and qualitative data from students, teachers, or other stakeholders. When designed with closed-ended questions (e.g., multiple-choice, Likert scale), they generate numerical data that can be statistically analysed. This makes them useful for measuring attitudes, opinions, and self-reported behaviours.
Logs from software
Logs from educational software can provide a wealth of quantitative data. These logs can include metrics such as time spent on tasks, number of attempts, completion rates, and performance scores. This type of data is particularly useful in understanding student engagement and identifying patterns in learning behaviours.
Systematic observations
As discussed earlier, systematic observations involve completing a form during lessons to record specific events at certain times. This method generates quantitative data that can be analysed to identify trends and measure the frequency of certain behaviours or interactions in the classroom.
Test results
Test results are a direct source of quantitative data, providing measurable outcomes of student learning. Standardised tests, formative assessments, and summative exams can all yield valuable numerical data that can be analysed to evaluate student performance, instructional effectiveness, and areas needing improvement.
While questionnaires can be used to collect numeric data, they can also include open-ended questions to gather qualitative insights. This combination allows for a more comprehensive analysis, where numerical data can be complemented by rich, descriptive feedback. Understanding the context behind the numbers can provide deeper insights into the data and inform more effective interventions.
| Levels of engagement | Questionnaire, structured observation, personal reflections |
| Student performance | Test or quiz |
| Pupil’s ability to recall verbally | Systematic in-lesson observations |
| Assessment style in programming exams | Secondary data: exam papers |
| Students’ understanding of AI | Questionnaire |
| Pupil perseverance | Structured observations, personal teacher reflections |
| Teacher workload | Workload log |
| Pupils’ pattern-seeking skills | Specifically designed data collection instrument |
| Pupils’ code comprehension | Classroom tasks/worksheets |
| Students’ creativity | Look at Murcia (2020) A -E of children’s creativity |