The analysis of gathered data, both quantitative and qualitative, is vital for transforming raw information into meaningful insights. Proper analysis methods help uncover patterns, relationships, and trends, enabling researchers to draw well-founded conclusions. This rigorous approach ensures that the findings are valid, reliable, and actionable, contributing significantly to the research’s overall impact.
You’ve come a long way and now have some data to work through, make sense of and ultimately draw some meaningful conclusions. Here we will look at some of the ways you can organise your data, some methods to analyse what you have, the claims you can make having analysed and how those claims might add to the knowledge base of the pedagogy of Computing and Computer Science.
Of course, resist the temptation to conclude before the analysis of the data!
Revisit the original goals of your project, reminding yourself of what you have been investigating and why. What data have you been able to collect? Is it numeric? Is it text? Is it a combination of both?
Also, spend some time reflecting on the process as a whole. Did it go as planned? What changes might you make if you were to do it again? What challenges did you face and how did you overcome them?
Quantitative data analysis
Here we are dealing with the numeric data. There are three main types:
Numeric: calculations can be made, either discrete or continuous
Categorical: unordered data that can be converted to numbers e.g. gender, eye colour
Ordinal: is ordered on a scale e.g. how much you like chocolate
Various statistics, familiar from secondary school maths, can be used to describe the data set:
Mean
Median
Mode
Standard deviation
Skewness (normal or non-normal distribution)
Such analyses are best described visually using tables, charts and graphs.
It can also be useful to use these descriptive statistics (i.e. those derived from your sample) to produce inferential statistics (i.e. those that can be applied to a larger population).
Inferential statistics and their role in hypothesis testing
Inferential statistics are used to make inferences about a population based on a sample of data. This type of statistical analysis allows researchers to test hypotheses, draw conclusions, and make predictions. In the context of action research, inferential statistics play a crucial role in evaluating the effectiveness of interventions and understanding relationships between variables.
Types of hypothesis testing
Comparing two groups:
Example: Experimental group vs. control group.
Role: This type of hypothesis testing is used to determine if there is a significant difference between two groups. For instance, you might compare the test scores of students who received a new teaching intervention (experimental group) with those who did not (control group).
Comparing two variables:
Example: Homework submission rate vs. test results.
Role: This approach examines the relationship between two variables to see if they are correlated. For example, you might explore whether students who submit homework more regularly tend to achieve higher test scores.
Predicting a future outcome:
Role: Hypothesis testing can also be used to make predictions about future outcomes based on existing data. For instance, you might predict future student performance based on current engagement metrics.
Statistical significance:
Role: In hypothesis testing, you may find statistical significance in your results, meaning that the observed effect is likely not due to chance. Alternatively, you might not find statistical significance, suggesting that any observed differences or relationships could be due to random variation.
Types of different statistical tests
T-tests:
Purpose: Used to determine if there are significant differences between the means of two groups.
Example: Comparing the average test scores of two different classes.
Analysis of Variance (ANOVA):
Purpose: Used to compare the means of three or more groups to see if at least one group mean is different from the others.
Example: Comparing the effectiveness of three different teaching methods on student performance.
Correlation:
Purpose: Used to measure the strength and direction of the relationship between two variables.
Example: Examining the relationship between the number of hours studied and exam scores.
Regression analysis:
Purpose: Used to identify the cause-and-effect relationship between variables and to predict the value of a dependent variable based on one or more independent variables.
Example: Predicting student performance based on factors such as attendance, participation, and prior academic achievements.
By using these statistical tests, you can analyse your data to draw meaningful conclusions, validate their hypotheses, and inform future educational practices.
Qualitative data analysis
Qualitative data analysis involves more analysis and interpretation. If there is a large volume of data it can feel quite overwhelming. There is no right or wrong way to approach all of this data but, in general, you are looking for themes and categories that may have arisen at any stage of your project. Your early investigations may have given some idea of what you might be looking for in your data: deductive analysis. Alternatively, you have kept an open mind about what you might find and the themes and categories will be uncovered from your data: inductive analysis.
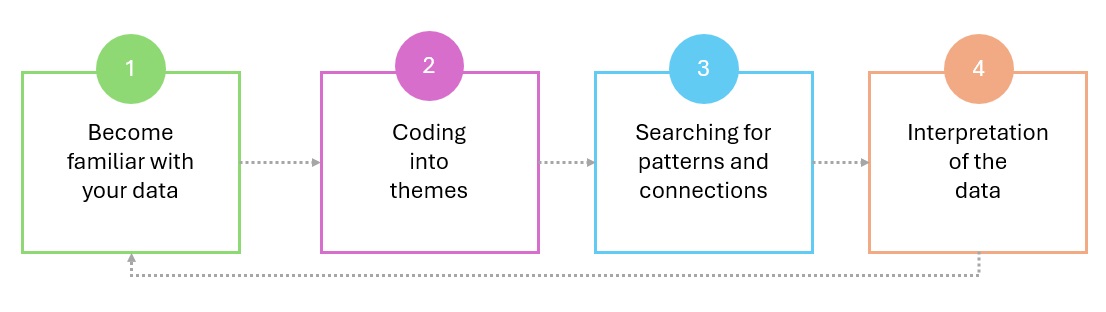
Develop a systematic approach:
Organise your data: How are they related? How do they support each other?
Read the content: Common words and themes should begin to emerge.
Highlight relevant sections, key terms: A highlighter pen is your best friend here, or more to develop colour coding for your themes.
Develop codes: Think of these as “tags” that can be assigned to pieces of data helping you to identify and organise key ideas, phrases or patterns in your data that fall under the various categories. (see below)
Develop categories to sort your evidence: These are the general themes that emerge from the data, the overarching concepts or ideas.
Refine the categories/codes: Constrain them to the most significant and/or best evidenced.
Interpret your findings: Develop meaning from the data.
Code and categories example
Deciding what is a category and what is a code takes experience. This example is offered to help.
Given the following answer to a question about online learning, a student has responded: “I find online learning very convenient because I can attend classes from home. However, I sometimes feel isolated because I miss the face-to-face interactions with my classmates.“, and another: “The flexibility of online learning allows me to balance my studies with my part-time job, but I struggle with staying motivated without the in-person support from my teachers.“